How are the stock markets reacting to the tariffs?
I have 3 charts showing performance over the past 365 days. You can see Friday’s value at the top of each chart, and also the “tooltip” popup box shows the value on January 21st, the day after Trump’s inauguration.
I’ll start with the Dow Jones Industrial Average. “The Dow” is what most people mean if they ask what’s the stock market doing.
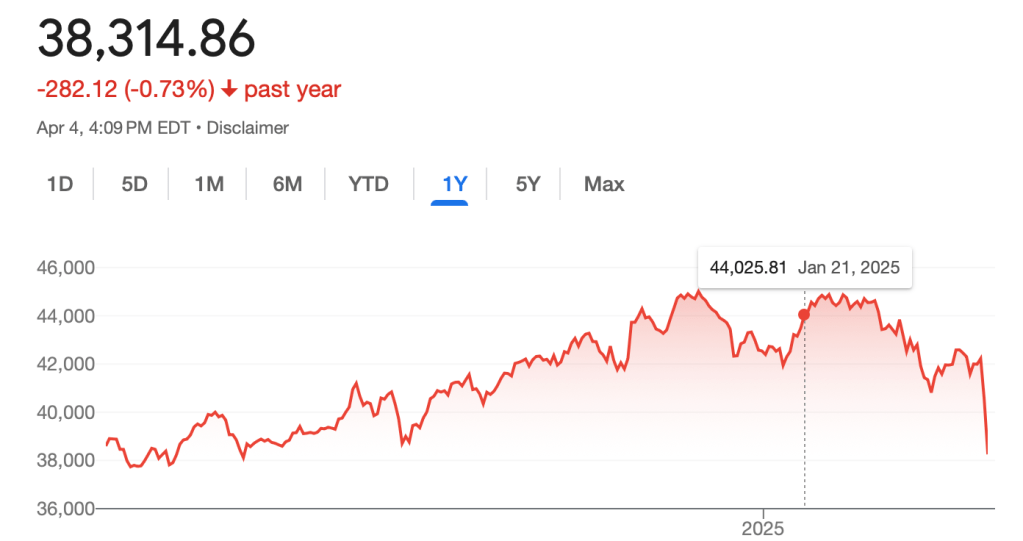
On the day after inauguration day, it closed at $44,025.81. Friday’s close was $38,314.86. That’s a drop of 12.97% in 73 days.

The S&P 500, which is basically the 500 leading companies, has dropped 16.12%, from $6,049.24 to $5,074.08.

And the tech heavy NASDAQ Composite index has dropped from $19,756.78 to $15,587.79, a 21.1% drop.
Coincidentally, 73 days is exactly 1/5 of 365, so let’s just play this out. Multiplying by 5 gives us where we may be come January 20, 2026.
The Dow would be at $15,471.08, wiping out the last 12 years of gains, and taking the value back to where it was in 2013.
The S&P 500 would be at $1,173.44, wiping out the last 15 years of gains, and taking the value back to where it was in 2010.
And the NASDAQ would be at -$1,088.17. Forget gains, that’s wiping out the NASDAQ entirely.
Let’s be honest… if this happened under the Biden administration, Republicans would be having a field day raking the Democrats over the coals, and with good reason.
I’m not asking any Trump supporter to admit you were wrong.
I’m asking you to admit you were lied to.
This is not what you were promised, is it?

You must be logged in to post a comment.